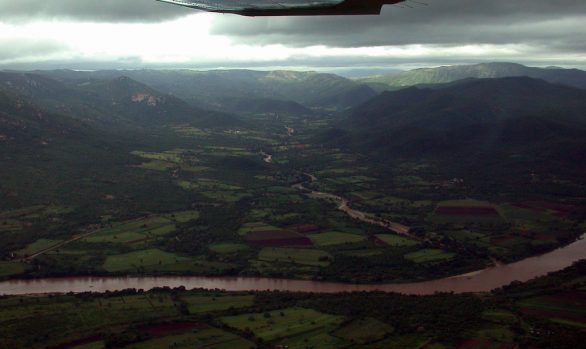
Route Geographic Consultants have invested in the latest technology for the implementation of airborne surveys. Together with our international partners in Germany, Botswana, Eswatini, United Kingdom and Samoa, RGC is capable of a quick and efficient deployment of air borne vehicles to do large scale aerial surveys across the globe.
These surveys cover a broad range of applications, but primarily are used in construction, monitoring, planning, remote terrain and the agricultural sphere.
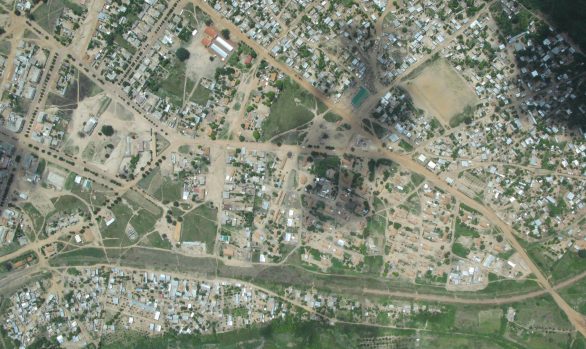
High Definition Images
The drones employed through our partner professionals integrate with some of the highest standard cameras to give sub centimetre pixel images. This allows for high level wide swath image capture with impressive detail. The more detailed the images, the more accurate the point cloud produced, but also the more onerous the processing of the data and use of the subsequent point cloud. It is thus a service we offer of analysing the images and point cloud based on the complexity of the project requirements to ensure that superfluous data is not captured or processed. A Fit for Purpose data plan for each project is discussed and implemented in collaboration with our clients before any surveys are undertaken. Additional image definition is given as options which include:
Drone borne LiDAR; Thermal Imaging
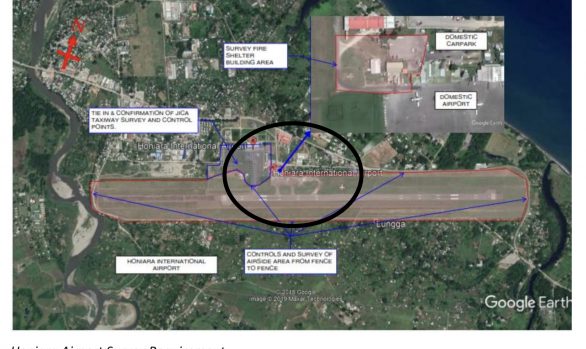
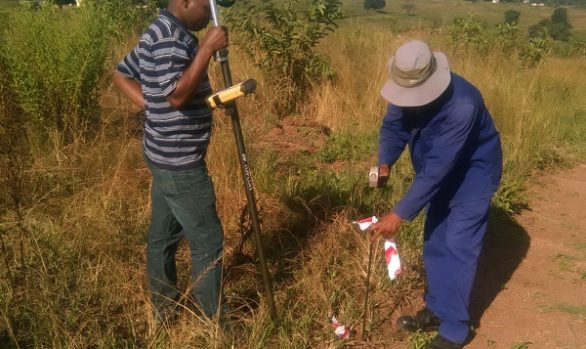
Fully Controlled to the Local System
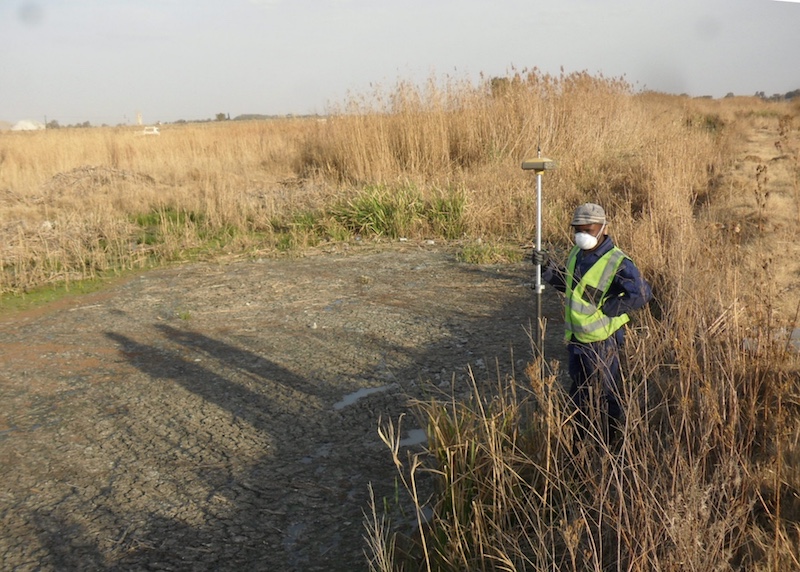
Regardless of the images needing to be captured, or the complexity of these, our excellent ground based survey technology is incorporated into each survey conducted by Air. Linking the surveys to the National Grid Network (NGN) is of critical importance as it provides the user with further options that would otherwise not be possible. These include:
Confidence in the heights of the Drone survey; incorporating the survey into the bigger picture for Hydrology and collaboration with existing third party surveys; Cadastral overlays and incorporation with social and environmental studies; conforming to international standards in the ERAP processes.
Having the survey on the NGN also allows for continuity of monitoring change over time.
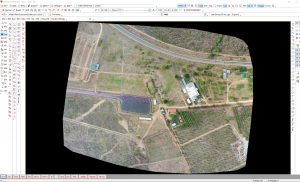
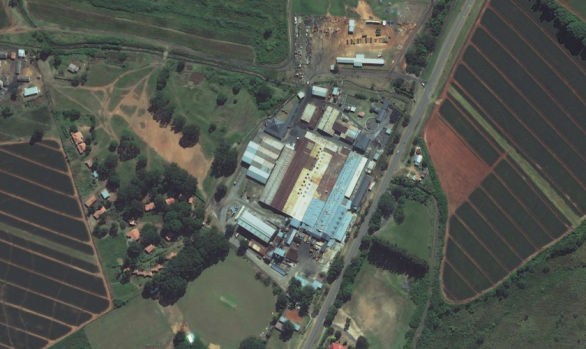
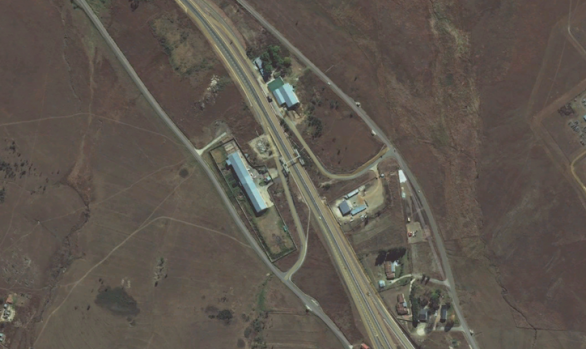
Orthometrically corrected TIFF files
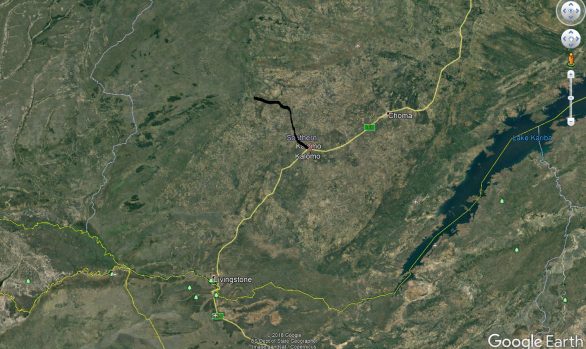
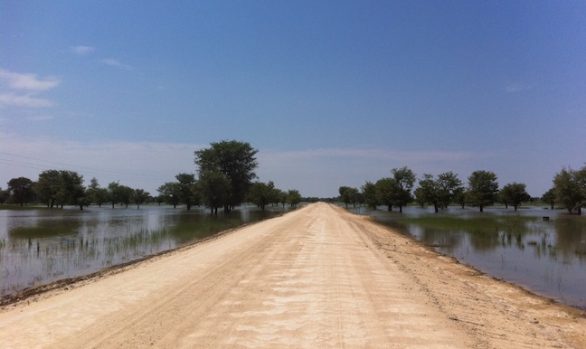
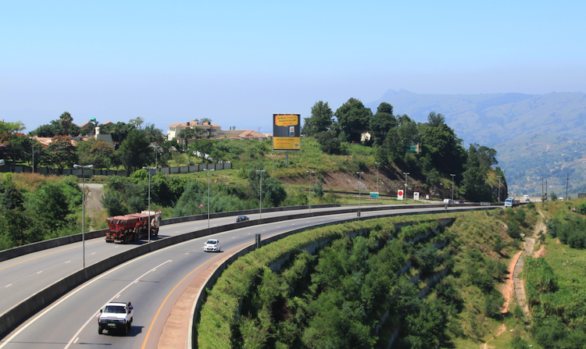
Using the images taken with either a stereoscopic overlap factor or those taken using LiDAR technology, the overall picture is stitched together to form one homogenous and corrected Orthometric Image in full HD. This image as is seen in the picture here, is then importable as a Tagged Image File Format, meaning that it is usable for accurate Horizontal measurements. Being surveyed with NGN control points takes it to the next level and positions the image on the surface of the Earth in a way that can be geo referenced across systems. So a TIFF file placed initially on a WGS84 Latitude Longitude referencing system can be viewed on a Arc1960 UTM Grid at the click of a button. This example would allow for the image to be used in open source software such as Google Earth and incorporated with data collected in Tanzania in the 1960’s. Design considerations and overall professional team collaboration becomes easily done, even with these who do not own expensive engineering software.

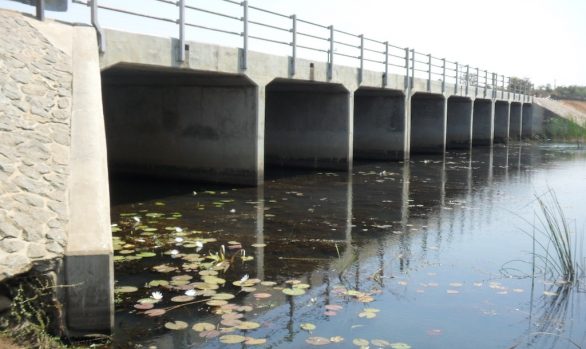
Digital Elevation Model
The final step in delivery of these corrected images is the Digital Elevation Model – or height information. This model is filtered for ground points and a comprehensive line drawing produced. This ensures that all edge level break lines are correct and the inconsistencies associated with LiDAR and Stereo plotting type drawings are dealt with by our in-house teams before reaching the engineers.
Although more and more engineering firms are capable of working with big data as found in point clouds, some prefer a clear set of traditional break lines and a triangulated ground model.
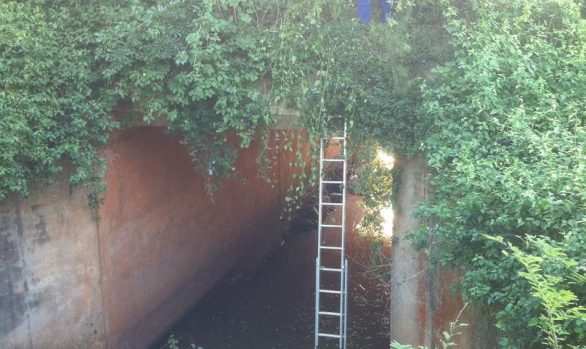
Taking the Orthophotos, combining these with the 3 dimensional point cloud data and then digitising the features as found on site, coupled with actual ground survey of obscured detail such as culverts and soffit levels, produces a fully usable survey model for all engineering applications.
In addition, the image is “draped” onto this model so as to produce a visually useful data set for monitoring and documentation.


RGC In Collaboration With